
Figure 8. Concentration dependence of amplitude, threshold and frequency of InsP3-induced changes in [Ca2+]L in the presence of oxidizable mitochondrial substrates.
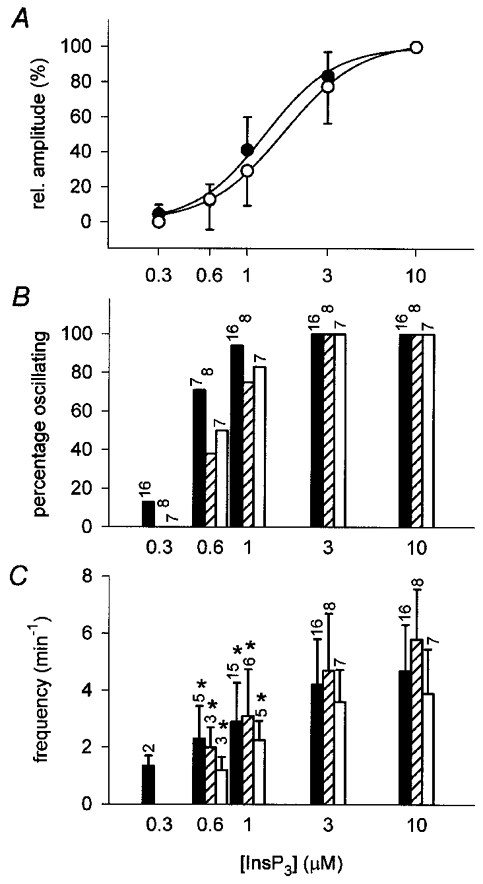
A, relative amplitudes of InsP3-evoked tonic falls in the mag-fura-2 ratio determined in ICM-citrate (•) or ICM-puruvate/malate (○). Amplitudes of declines at 10 μM InsP3 were set to 100 %. Data from experiments performed in ICM-succinate are similar and are not shown for reasons of clarity. B, fraction of preparations responding with [Ca2+]L oscillations to a given [InsP3] in ICM-citrate (filled bars), ICM-succinate (hatched bars), or ICM-pyruvate/malate (open bars). Numbers above bars indicate the number of experiments included in each data set. C, oscillation frequencies at different [InsP3] in the presence of mitochondrial substrates: citrate (10 mM, filled bars), succinate (10 mM, hatched bars), or pyruvate/malate (5 mM each, open bars). Numbers, as B. *Oscillation frequencies that are significantly (P < 0.05) different from the frequencies at 10 μM InsP3 (see also Table 2). Amplitudes of tonic declines, fractions of responsive preparations, and oscillation frequencies were determined as described in Fig. 5.