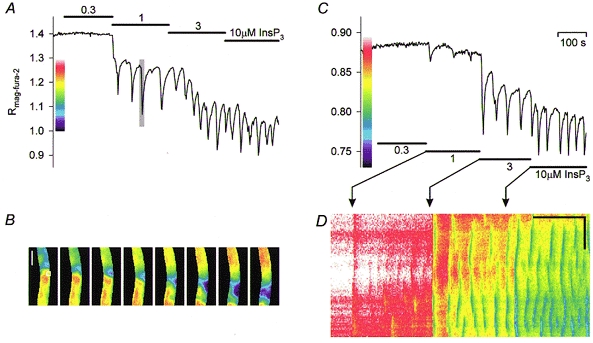
Figure 9. Spatio-temporal pattern of InsP3-mediated [Ca2+]L oscillations.

InsP3 delivered at increasing concentrations in ICM-citrate (A) or ICM-pyruvate/malate (C). B, series of pseudocolour images of the mag-fura-2 fluorescence ratio corresponding to the time segment indicated by the shaded area in A. Image intervals 2 s. The lateral diameter of the secretory cells that form the tube-like single-layered epithelium is ≈15-20 μm. The white box (19 μm × 19 μm) indicates the region selected to construct the graph in A; vertical scale bar 100 μm. D, space-time plot of B. A line (1 pixel × 102 pixels, 3.8 μm × 385 μm) projected onto the permeabilized gland was sequentially extracted from a series of pseudocolour images of the mag-fura-2 ratio and stacked according to the time of acquisition. Thus, the ordinate of the plot represents the location, whereas the abscissa represents time. Bands of altered pseudocolours in the plot reflect coordinate transient falls in [Ca2+]L. Horizontal scale bar 100 s, vertical scale bar 100 μm.
