
Figure 3. Grouped data for the responses to transmastoid stimulation before and after a 2 min MVC with maintained ischaemia of the forearm muscles.
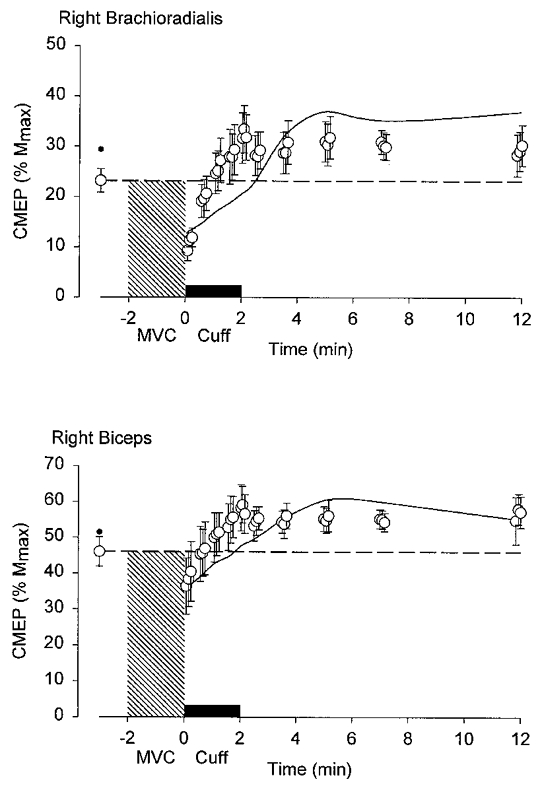
Upper and lower panels show the normalized responses (percentage maximal M-wave, Mmax) from brachioradialis and biceps brachii. The hatched region denotes the period of contraction and the filled bar above the x-axis denotes the period of ischaemia produced by inflation of a sphygmomanometer cuff just before the end of the contraction. Means ±s.e.m. (n= 7). Time zero corresponds to the end of the MVC. The response to transmastoid stimulation is depressed following the MVC but it recovers despite ischaemia of the arm. For comparison, data from a previous study in the same subjects in whom there was no maintained ischaemia are given as a small filled circle (before the MVC) and as a continuous line between original data points (Gandevia et al. 1999).