
Figure 3. Spectral composition of subthreshold oscillation in magnocellular neurones.
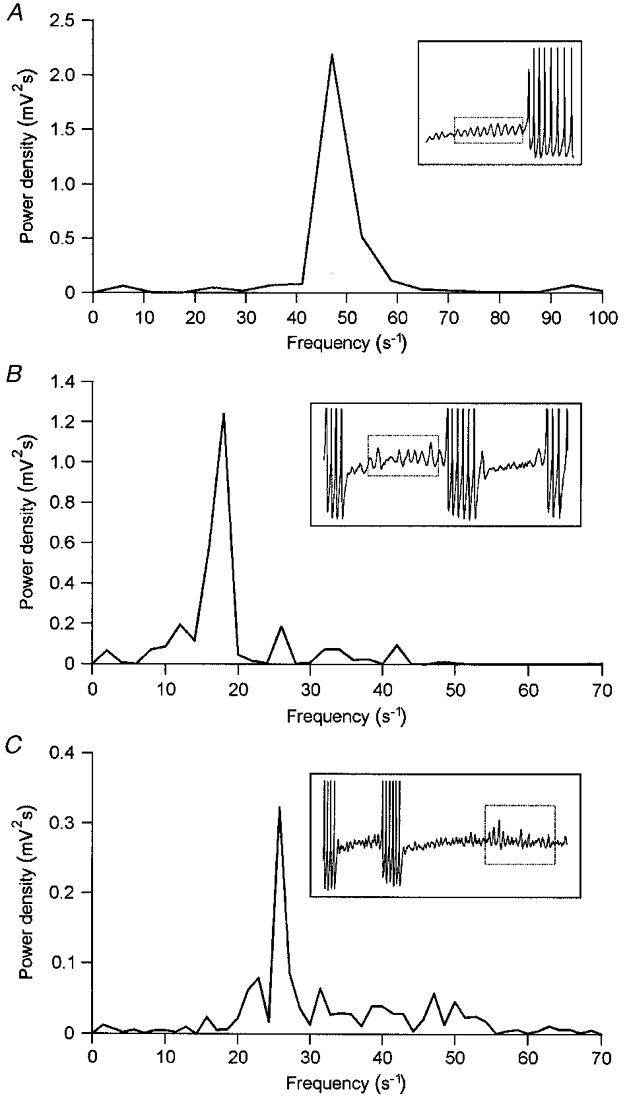
A, DFT power density spectrogram of the sinusoidal subthreshold oscillation induced by depolarization in a neurone not spontaneously discharging during control recording. A high-frequency peak at 47 Hz dominates the spectrogram. B, DFT power density spectrogram of the oscillatory activity generated during burst intervals by a neurone discharging short bursts of action potentials. The spectrogram is composed of a narrow low-frequency peak at 18 Hz and smaller peaks at 12, 26 and 42 Hz. C, DFT power density spectrogram of the oscillatory activity generated during a burst interval in a neurone discharging bursts of action potentials with highly variable burst intervals. The broad band spectrogram is dominated by a low-frequency peak at 26 Hz. Insets represent the original voltage recordings; the respective sequence of oscillation waves selected for DFT analysis is indicated by a dotted box. Records are truncated.