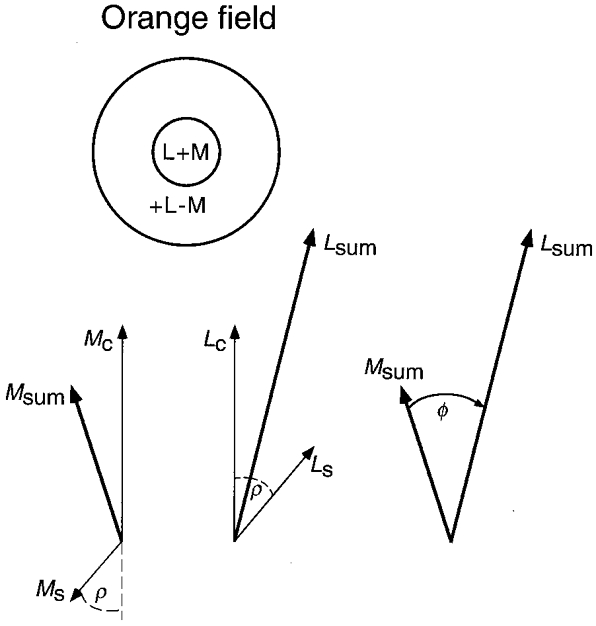
Figure 1. Phasors showing model response of on-centre MC retinal ganglion cells to luminance flicker on the orange field.

Response phasors are shown separately for L and M components of the receptive field centre (C) and surround (S). The centre summates L and M signals (L+M). Chromatic adaptation modifies the surround – on the orange field at low temporal frequency the M surround is antagonistic to the M centre, but the L surround with opposite sign is facilitory (+L-M). (On the green field the L and M surround components are reversed in sign.) L and M surround components are delayed by ρ deg relative to the centre. Total L and M responses to luminance flicker are represented by sum phasors Lsum and Msum. The angle between Lsum and Msum represents the phase shift (Φ) between the L′ and M′ signals in LUM, and the ratio of lengths Lsum/Msum represents the ratio of L′ and M′ contrast weights. Both effects vary with temporal frequency owing to the surround delay. (The phasors depicted here were previously used to fit phase data for observer C.F.S. measured with 1 cycle deg−1 patterns on the orange field, with the delay shown for 3 Hz.)
