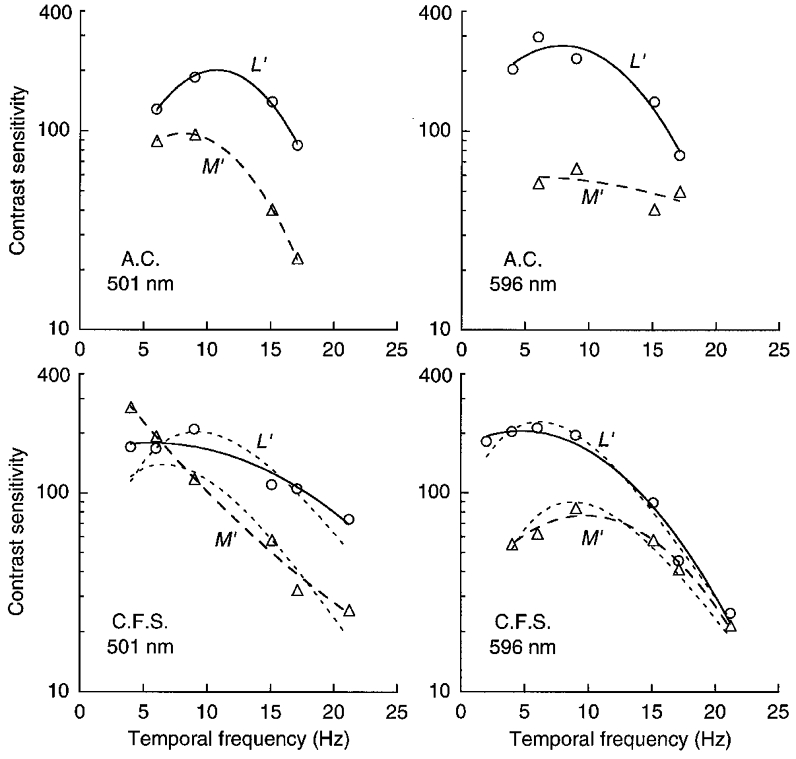
Figure 2. LUM motion sensitivity for L′ and M′ drifting gratings of 1 cycle deg−1 on green and orange fields.

Cone contrast sensitivity is shown for discriminating left versus right motion for patterns stimulating L or M cones. On the green field (501 nm, 1300 Td; left panels) L′ and M′ sensitivities are similar at low temporal frequency, but L′ sensitivity is greater at high temporal frequency. On the orange field (596 nm, 1300 Td; right panels) L′ sensitivity is considerably greater than M′ sensitivity at low temporal frequency and the curves converge at high temporal frequency. The continuous and dashed lines simply help connect data points. (Short-dashed lines for C.F.S. are based on estimates of the impulse response functions.)
