
Figure 3. Ratio of L′ to M′ weights in LUM mechanism from Fig. 2.
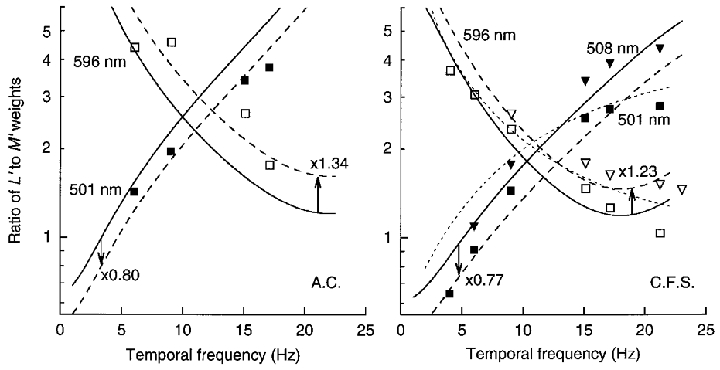
The ratio of weights represents the ratio of L′ and M′ contrast sensitivities in Fig. 2. The ratios change strongly with temporal frequency in opposite directions on the green (▪) and orange (□) fields. (Additional measurements for C.F.S. were obtained with slightly different fields of 508 (▾) and 596 nm (▿) at 1580 Td.) Continuous curves are fits of the MC cell model – small vertical shifts (dashed lines) improve the fits in some cases. (The short-dashed lines for C.F.S. are based on the short-dashed lines of Fig. 2 for the estimated impulse response functions.)