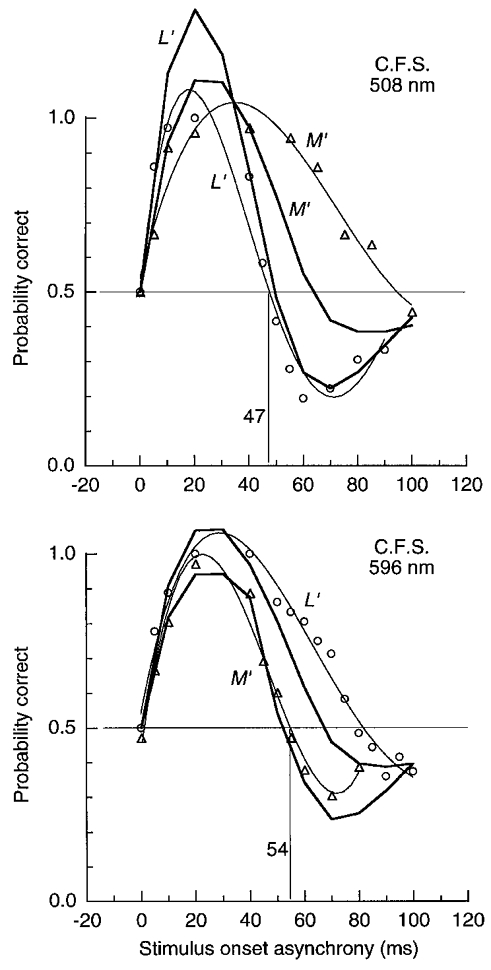
Figure 6. LUM motion for pairs of pulsed L′ or M′ gratings of 1 cycle deg−1 on green and orange fields.

Probability correct for direction judgements of pairs of pulsed (15 ms) L′ or M′ gratings in quadrature spatial phase as function of SOA. Gratings were of fixed contrast: L′ and M′ contrast were 0.067 and 0.056 on the green field and 0.046 and 0.106 on the orange field. Reversed motion is indicated by < 0.5 probability correct. Fitted curves extend above the response ceiling of 100 % correct – thin curves simply help connect data points; thick curves show predictions from the impulse response functions described later (jags in curves indicate points where predictions were calculated). Field luminance was 1580 Td.
