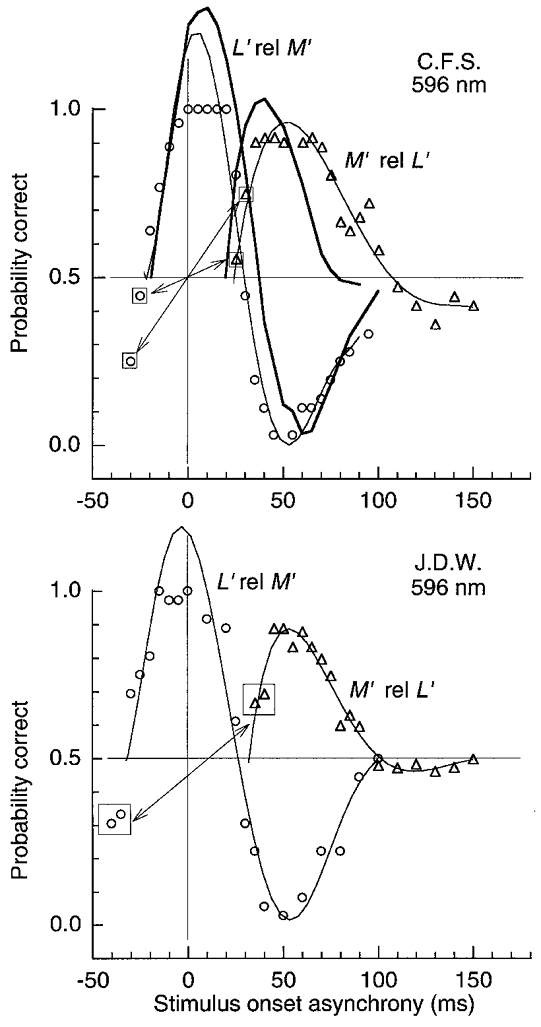
Figure 8. LUM motion for a pair of pulsed L′ and M′ gratings of 1 cycle deg−1 on the orange field.

For ○, SOA is specified for the L′ pattern varied relative to M′– motion is strong at 0 SOA and the L′ pattern must be temporally advanced ≈25 ms (to about -25 SOA) to null the motion. ▵, data with the SOA of the M′ pattern varied relative to L′ originally plotted as ○ from -30 to -150 SOA, but now transformed to ▵ by reflection, as illustrated by boxed symbols. Thin curves connect data points; thick curves (for C.F.S.) show predictions from the impulse response functions described later. Pulse duration was 15 ms; L′ and M′ contrast was 0.045 and 0.10; field luminance was 1580 Td.
