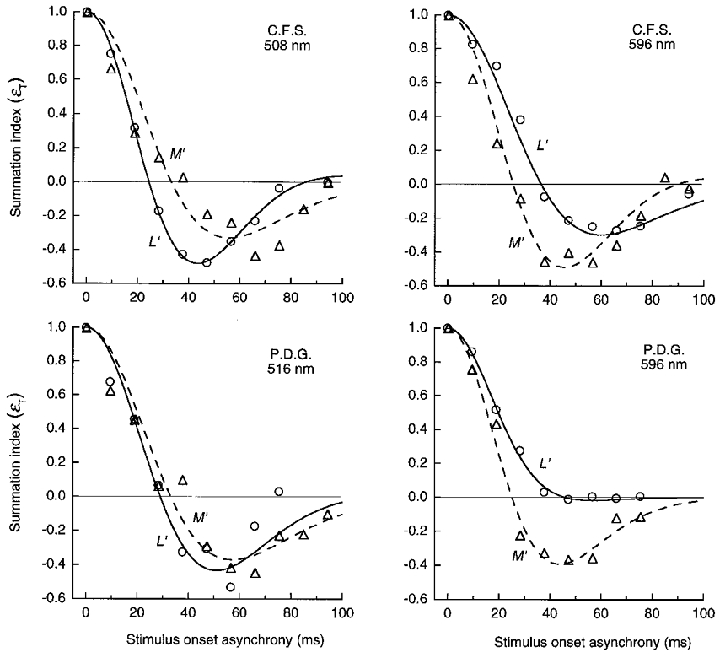
Figure 11. LUM summation for pulsed L′ or M′ gratings of 1 cycle deg−1 on green (left) and orange (right) fields.

Summation between pairs of L′ or M′ pulsed (10 ms) gratings as function of SOA. Summation index (εT, normalized to 1.0 at 0 SOA) was derived from the thresholds for in phase and antiphase gratings (see text). The summation index describes the autocorrelation function of impulse response of the L′ and M′ signals in LUM. Curves show least-squares fits of the autocorrelation function based on a model of the impulse response. Orange field luminance was 1580 Td and green field luminance was 1580 or 1380 Td (C.F.S. or P.D.G., respectively).
