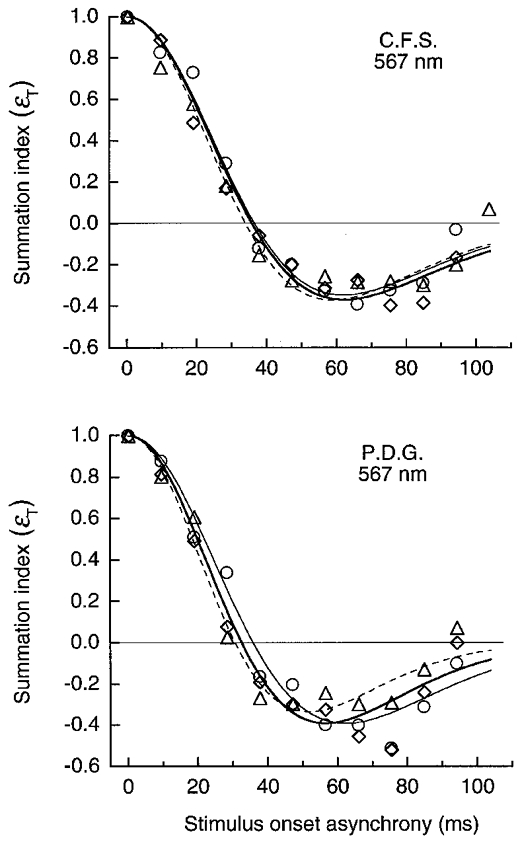
Figure 12. LUM summation for pulsed gratings of 1 cycle deg−1 on the yellow field.

Summation, depicted as in Fig. 11, for pairs of L′ (○, thin continuous line), M′ (▵, dashed line) or pure luminance LUM (⋄, thick continuous line) gratings. Curves show fits based on the impulse response. Pulse duration was 10 ms; field luminance was 1580 Td.
