
Figure 3. Recordngs of FMRFamide-activated whole-cell currents, and unitary currents in outside-out patches, from Helisoma neurones.
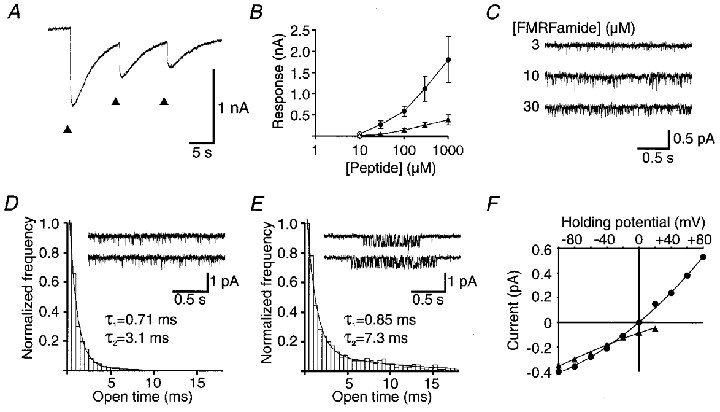
A, inward current responses were observed in isolation when recordings were made at the K+ equilibrium potential (approximately -100 mV). Repeated application of FMRFamide (arrowheads) resulted in partial desensitization, as with the response in Helix neurones (see Green et al. 1994). B, dose-response relationship for FMRFamide (circles) and FLRFamide (triangles). For filled symbols (with s.e.m. bars), n = 3-6 for both FMRFamide and FLRFamide; for open symbols, n = 1 or 2. C, unitary currents activated by 3, 10 or 30 μM FMRFamide in an outside-out patch from the GDN. The holding potential was -100 mV. D and E, open time frequency distribution histograms of the unitary currents activated by 10 μM FMRFamide recorded from neuronal outside-out patches, illustrating the two modes of channel opening encountered in neuronal patches. The data of the mode of activity represented in the inset in D were fitted with the sum of two time constants: 0.71 ms (97 %) and 3.1 ms (3 %). Data of the type shown in the inset in E were fitted by the sum of two exponential components: 0.85 ms (92 %) and 7.3 ms (8 %). F, current-voltage relationship for unitary currrents recorded with CsF (▴) or NaF (•) in the recording pipette solutions, similar to Fig. 2F.