
Figure 2. Electrophysiological characterization of Ih.
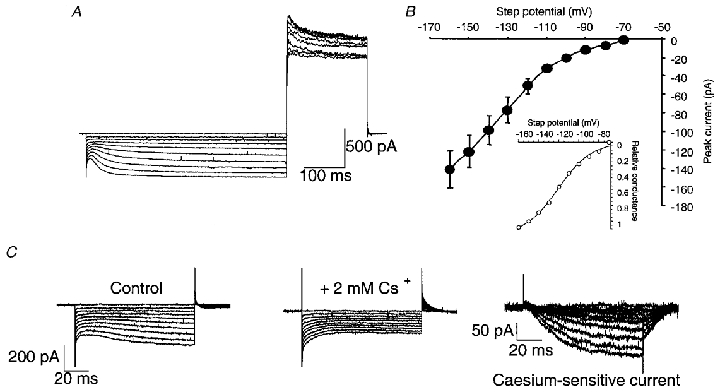
A, hyperpolarizing steps from a holding potential of -70 mV in a basket cell nerve terminal reveal an Ih current. Steps were 500 ms long from -70 to -160 mV, in -10 mV increments, followed by a return step to +30 mV. The return step shows the voltage-activated outward K+ current. No leak subtraction was used. B, current-voltage plot for Ih current in basket cell terminals. Peak inward current was measured (at the end of the voltage step), from 5 terminals from 5 mice, by subtracting the current remaining after caesium block from the control current (see C, and Results). Inset shows a Boltzmann curve fitted to these data, which has a V½ of -120 mV and k value of 16 mV. C, voltage steps from -70 to -160 mV in control, and in 2 mM CsCl, and the resulting Ih current revealed by subtraction.