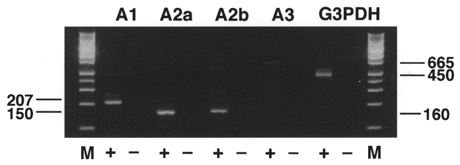
Figure 1. RT-PCR analysis of adenosine receptor mRNAs expressed in the rat SON.

Total RNA from rat SON was reverse transcribed (+) or not (−), then amplified by PCR with each of the primer pairs described in Table 1. Primers for G3PDH were used as an internal control and generated a 450 bp fragment. Amplification products were electrophoresed on a 2 % agarose gel and visualized by ethidium bromide staining. Lane M, Hi-Lo DNA ladder marker (Avetech, Tokyo, Japan). When PCR from each sample was performed without prior reverse transcription, there was no amplification product, indicating that the bands appearing on the gel were not derived from genomic DNA. The sizes of the bands are given in base pairs.
