
Figure 1. Concentration-dependent effects of Ba2+ on IHERG.
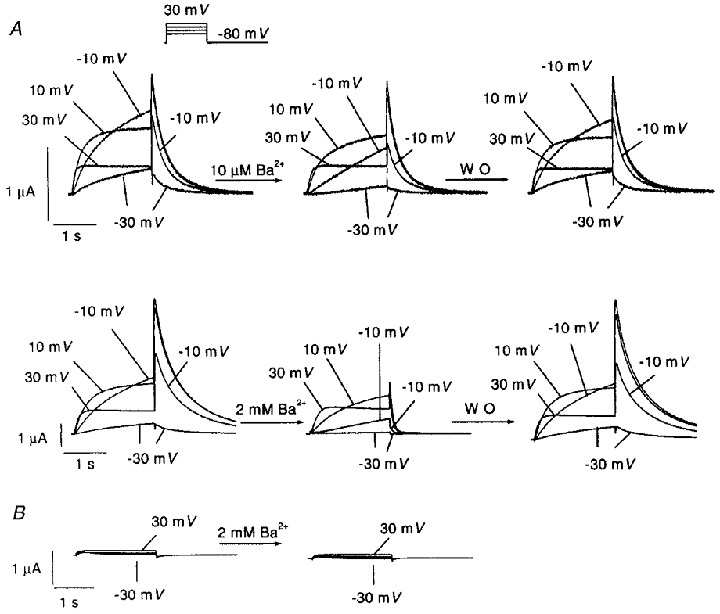
A, original recordings showing effects of 10 μm and 2 mm Ba2+ on IHERG in one oocyte each. IHERG was recorded with 2 s pulses to the voltages indicated (protocol inset). Leftmost panels are control recordings. Inhibitory effects were recorded 3 min after Ba2+superfusion (centre panels). Effects were reversible upon 12 min of washout (WO, right panels). Capacitance transients have been blanked out. B, typical example of currents recorded from water-injected oocytes before (left) and after (right) exposure to 2 mm Ba2+.