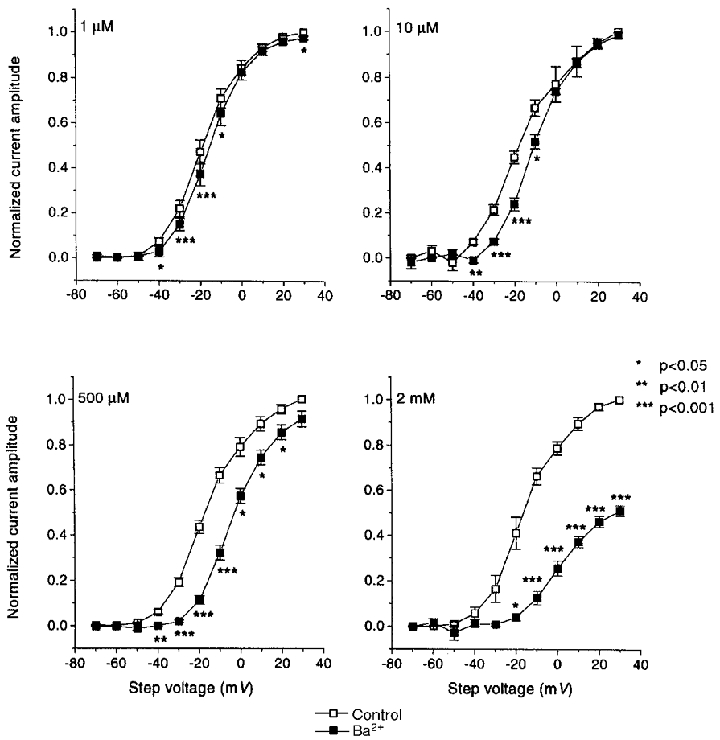
Figure 3. Inhibition of HERG tail current by various concentrations of Ba2+.

Results are means ±s.e.m. for 5, 5, 5 and 4 oocytes studied before and after 1, 10, 500 μm and 2 mm Ba2+, respectively. Tail currents were recorded returning to the Vh of -80 mV following 2 s steps to the voltages indicated. Current amplitudes were estimated by fitting the deactivation phase of the tails to biexponential functions and extrapolating back to the beginning of the repolarizing step. All currents were normalised to the maximum control current amplitude (* P < 0.05, ** P < 0.01, *** P < 0.001 vs. control). Data were fitted to Boltzman functions (IHERG= (1 + exp [(V½+Vt/k)])−1) where V½ is the half-activation voltage, Vt is the test voltage applied and k is the slope factor. V½ and k (in mV) estimated from the fits were: -18.9 ± 0.5, 9.7 ± 0.5; -17.7 ± 1, 11.1 ± 1.0; -17.2 ± 0.7, 10.5 ± 0.7; -16.3 ± 0.7, 10.1 ± 0.7 under control conditions and -16.0 ± 0.5, 8.7 ± 0.4; -10.7 ± 1, 9.0 ± 1.0; -4.4 ± 0.8, 8.9 ± 0.7; 1.0 ± 1.7, 9.6 ± 1.4 mV for 1, 10, 500 μm and 2 mm Ba2+, respectively.
