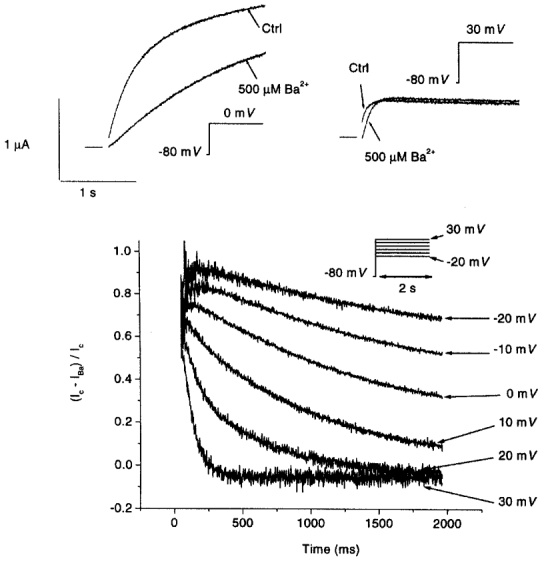
Figure 4. Evolution of Ba2+ block of IHERG during depolarization.

Top, original recordings during 2 s depolarizations to 0 mV (left) and 30 mV (right) before and after superfusion with 500 μm Ba2+. Capacitive transients have been removed. Horizontal bars indicate zero current levels for the adjacent traces. Bottom, evolution of fractional block (Ic–IBa)/Ic, where Ic and IBa are currents under control conditions and in the presence of 500 μm Ba2+, respectively, in the same experiment, upon depolarization to the 6 voltage levels indicated. Similar results were obtained in 4 other oocytes.
