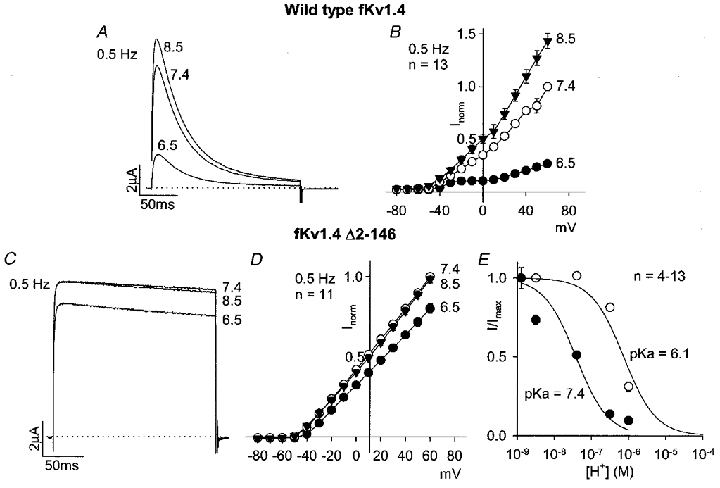
Figure 3. Effect of pH on wild-type fKv1.4 and mutant fKv1.4 lacking the N-terminus (fKv1.4 Δ2-146).

A and C, wild-type fKv1.4 (A) and fKv1.4 Δ2-146 (C) currents at pH 8.5, 7.4 and 6.5 during a pulse to +60 mV (pulse frequency, 0.5 Hz). B and D, mean current-voltage relationships for wild-type fKv1.4 (B) and fKv1.4 Δ2-146 (D) at pH 8.5 (▾), 7.4 (○) and 6.5 (•) at a pulse frequency of 0.5 Hz. E, mean dose-response curves for the effect of pH on wild-type fKv1.4 (•) and fKv1.4 Δ2-146 (○). Current at +60 mV at 0.5 Hz (normalized to the theoretical maximum current under alkaline conditions) is plotted against H+ concentration (on a logarithmic scale). Data were fitted with typical dose-response curves (assuming a Hill coefficient of 1); pKa values are shown.
