Table 1.
Time constants of recovery from inactivation at −80 mV
| Channel/conditions | pH 8.5(% change) | pH 8.5(s) | pH 7.4(s) | pH 6.5(s) | pH 6.5(% change) | n |
|---|---|---|---|---|---|---|
| Wild-type rKv1.4 | −23 | 1.1 ± 0.1 | 1.4 ± 0.1 | 2.6 ± 0.2 | 84 | 5 |
| Wild-type fKv1.4 | −9 | 1.6 ± 0.1 | 1.8 ± 0.1 | 5.3 ± 0.6 | 201 | 5 |
| rKv1.4 Δ2–39 (Δball 1) | — | — | 53.0 ± 4.9 | 69.7 ± 9.3 | 32 | 5 |
| rKv1.4 Δ39–162 (Δball 2) | −39 | 2.9 ± 0.3 | 4.8 ± 0.9 | 14.9 ± 0.6 | 310 | 5 |
| rKv1.4:Kv1.2 | −7 | 1.2 ± 0.3 | 1.3 ± 0.2 | 1.2 ± 0.2 | −9 | 5 |
| rKv1.4 H508Q | −20 | 1.7 ± 0.2 | 2.1 ± 0.3 | 1.8 ± 0.2 | −13 | 5 |
| Wild-type rKv1.4, 99 mm K+ | −15 | 0.2 ± 0.01 | 0.2 ± 0.02 | 0.2 ± 0.01 | 8 | 4 |
| rKv1.4 K532Q | — | — | 12 ± 4 | — | — | 3 |
| rKv1.4 K532Y | −14 | 0.7 ± 0.1 | 0.8 ± 0.2 | 0.7 ± 0.2 | −12 | 4 |
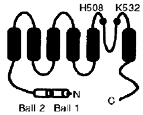
Percentage changes are given with respect to values at pH 7·4. n, number of oocytes studied. Some time constants for rKv1.4 Δ2–39 and rKv1.4 K532Q are missing, because the slow recovery of rKv1.4 Δ2–39 precluded measurement of recovery under all conditions and rKv1.4 K532Q current was too small in acidosis to be measured. The inset shows the membrane topology of Kv1.4 and the locations of mutations made.

