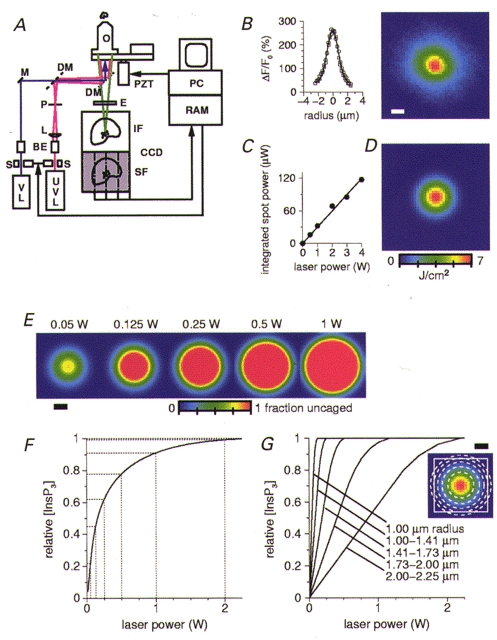
Figure 1. The process of spot photolysis of InsP3 was modelled in order to estimate the relative [InsP3] that evoked regional Ca2+ release.

A, a simplified diagram of the high-speed microscope. An argon-krypton visible laser (VL; λ= 488 nm, shown in purple), was used to excite Calcium Green, while an Argon-Ion ultraviolet laser (UVL; λ= 351 and 361 nm, shown in pink), was used for photolysis of InsP3. The UV beam was passed through a 3 mm aperture laser shutter (S), a telescope beam expander optic (BE), a converging lens (L) and a pinhole (P). The visible and UV beams were combined by a dichroic beam combiner (DM, 400DCLP, Chroma), and focused onto the cell through a Nikon × 40 UV, 1.3 NA, oil-immersion objective lens (O). The Calcium Green fluorescence, shown in green, was imaged onto the 128 pixel × 128 pixel image frame (IF) of the high-speed, frame-transfer CCD camera. At the end of an exposure, this image was quickly (∼50 μs) shifted into the storage frame (SF) for transfer to the PC. (Abbreviations: M, mirror; PZT, piezomotor; E, emission filter.) B, the photolysis spot produced within the cells was imaged using the Calcium Green fluorescence excited by the UV beam, and used to determine the spatial profile of the spot. The image shown is the average of five, 1 W, spots from five different cells. Scale bars here and in E and G are 1 μm. Intensity profiles through the average spot, both horizontally (○) and vertically (□) are shown to the left, and were well fitted with a gaussian profile (σ= 0.818 μm) having a full-width at half-maximal intensity (FWHM) of ∼2 μm. C, the actual total (integrated) spot photolysis power seen at the cell was measured and shown to vary linearly with the range of laser power settings used in the experiments. D, the image shows the 2-D gaussian profile of photon density (J cm−2) calculated from the total number of UV photons delivered by a 1 W laser setting at the spot in a 10 ms period. E, the fraction of InsP3 that was uncaged was calculated from the photon density images from five laser power settings using the cross-section and quantum yield of caged InsP3. For laser settings above 0.05 W, there is a region at the centre of the spot where the photon density is sufficient to uncage all the InsP3 present. The size of this region increases with the laser power. F, the relationship between laser power and the average, relative [InsP3] within a 4 μm diameter area, corresponding to the ΔF/F0 measurement region, is not linear, due to the contribution from the expanding region of photolysis saturation. G, the relationship between laser power and the average, relative uncaged [InsP3] at different radii from the centre of the spot is shown for five annuli of equal area (as indicated in the inset by the dotted lines at radii of 1, 1.41, 1.73, 2 and 2.25 μm).
