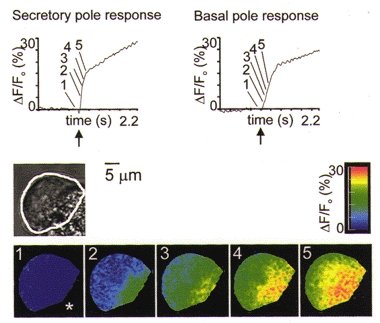
Figure 2. The global Ca2+ response to global photolytic liberation of InsP3.

Cells were microinjected with Calcium Green and caged InsP3. The bright-field image shows the outline of the cell (estimated by eye from the fluorescence image) as a white line. This outline was used as the mask for the ΔF/Fo images. The secretory pole was identified by the clustering of zymogen granules. Cells responded, with a short latency and a secretory to basal pole Ca2+ wave, to global photolytic release of InsP3 (time point indicated by arrow on graphs). Indicated on the graphs are the responses recorded in 2 μm diameter regions in the secretory pole and basal pole. The ΔF/Fo images of Calcium Green fluorescence are proportional to the changes in intracellular [Ca2+] and are shown as a pseudocolour representation according to the colour scale on the right. The asterisk indicates the orientation of the cell and is placed in the direction of the secretory pole. Prior to the photolytic release of InsP3 the resting [Ca2+] was low (image 1). The first image that exceeds a threshold of 5 % in the secretory pole is shown (image 2) and subsequent frames were taken at consecutive 36 ms intervals.
