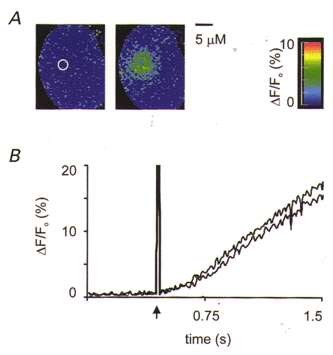
Figure 3. Control spot photolysis experiments.

A, cells filled via the patch pipette with caged fluorescein were used to test the spatial extent of the stimulus. In these experiments exactly the same spatial stimulus parameters were used as for those with caged InsP3; that is, a spot of ∼2 μm diameter at the image plane. The first image (left) shows an even fluorescence throughout the cell. Also indicated, by the white circle, is the region of the UV spot (FWHM). An image taken 200 ms after spot photolysis (right) shows a spatially limited increase in fluorescence in the region of the UV flash. B, cells filled with caged InsP3 were given repeated high-intensity UV spot flashes. Two consecutive Ca2+ responses from a 4 μm diameter region, centred over the photolysis region are shown in the graph. The similarity of these responses shows reproducibility and along with the ‘dose’-response relationships shown in Figs 5A, and 6C and D suggests that the cells were not significantly damaged by laser light.
