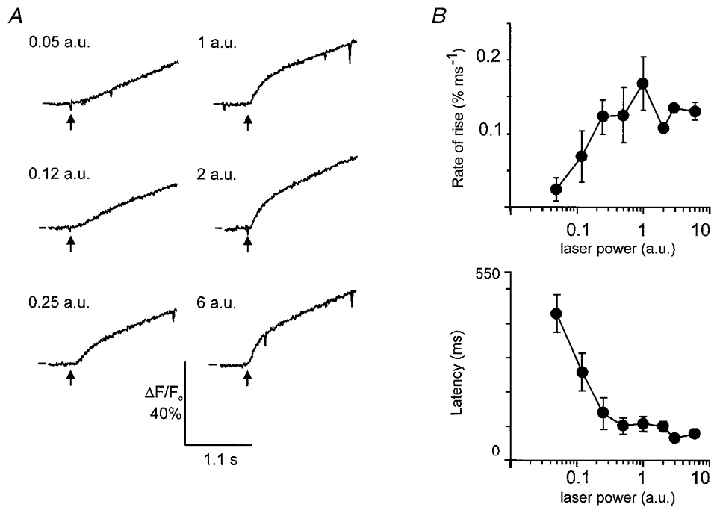
Figure 5. The secretory pole Ca2+ dose-response to spot InsP3 liberation in the secretory pole.

A, in a single cell, repeated photolytic liberation of InsP3, at different intensities of UV laser light, gave rise to a ‘dose’-dependent increase in the rate of rise and amplitude of the Ca2+ response. The order of presentation of the different intensity UV flashes was randomized. In this particular case the order was (laser power (a.u.)): 1, 0.25, 0.12, 0.05, 2, 6. The data show the reproducibility of the responses and saturation at the higher stimulus intensities. The lines on the left-hand side of each trace indicate ΔF/F0= 0. B, the means of the maximal rates of rise of the fluorescence signal are shown plotted against laser power. Mean latency to a 5 %ΔF/F0 change is plotted against UV laser intensity, showing a decline to a minimum with increasing light intensities. Error bars are s.e.m.
