
Figure 6. Examples of the Ca2+ response, in two different cells, to the spot liberation of InsP3 in the basal pole region.
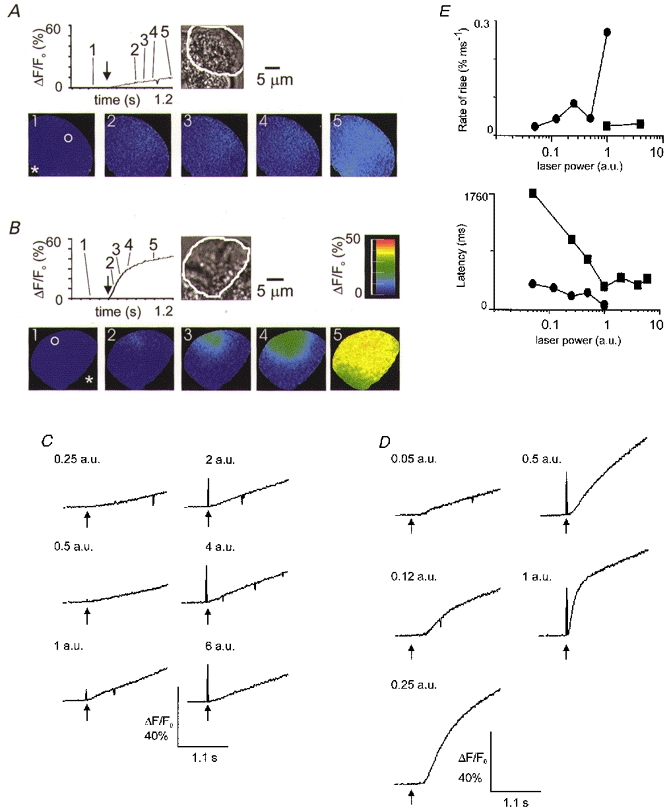
InsP3 release in the basal pole region elicited either a weak response (A, 1 a.u. laser power) or a response indistinguishable from that induced in the secretory pole (B, 1 a.u. laser power). C, in a single cell (the same as that shown in A), repeated UV photolysis in the basal pole elicited poor Ca2+ responses that showed little ‘dose’ dependence in the rate of rise and long latencies to a ΔF/F0 of 5 %. The order of presentation of the stimuli was random; in this particular case it was (laser power, a.u.): 1, 0.5, 0.25, 2, 4, 6. D, in a single cell (the same as that shown in B), repeated UV photolysis in the basal pole elicited a ‘dose’-dependent effect on the rate of rise of the Ca2+ signal and on the latency. Again the order of presentation of the stimuli was random; in this particular case it was (laser power, a.u.): 1, 0.25, 0.12, 0.05, 0.5. E, graphs show the latency and maximum rates of rise for each of the cells (▪, cell in A and C; •, cell in B and D). (Note, a latency of longer than 1760 ms (at 0.125 a.u. for the cell in A and C) is indicated on the graphs as 1760 ms. Also rates of rise of less than 0.02 % ms−1 were difficult to measure for the cell in A and C and were not included on the graph.)