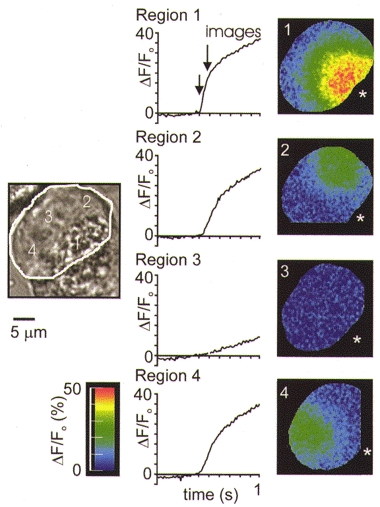
Figure 7. The Ca2+ response to regional spot photolysis of InsP3 in four places within a single cell.

The response of a single cell to repeated InsP3 liberation in different regions. The left-hand arrow shows the time point of flash photolytic release of InsP3. The pseudocolour images were taken at the time point indicated by the arrow marked ‘images’. In the secretory pole (region 1) a vigorous response was observed. Regions 2, 3 and 4 in the basal pole show variability in the responses to the same stimulus. To position the photolysis spot in some regions of the basal pole, parts of the cell sometimes fell outside the camera field of view (images 2 and 4).
