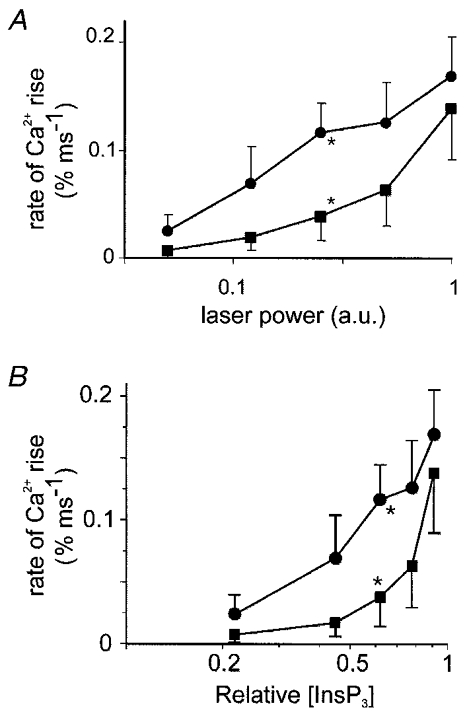
Figure 8. Comparison of the InsP3 dose relationship to the rate of Ca2+ rise.

The responses are plotted either against laser power expressed in absolute units (A) or against the relative [InsP3] calculated from our model (B). The mean secretory pole responses (n = 12 cells, •, error bars are s.e.m.) and the mean of the active basal pole responses (n = 4, ▪, error bars are s.e.m.) are shown. The points indicated by the asterisks were significantly different at P < 0.05 (Student's one-tailed t test), all other points were not. The units of the InsP3 dose are relative [InsP3], estimated as described in Methods and illustrated in Fig. 1. From the injected concentrations of caged InsP3 we would estimate the maximum [InsP3] to be 10-50 μm.
