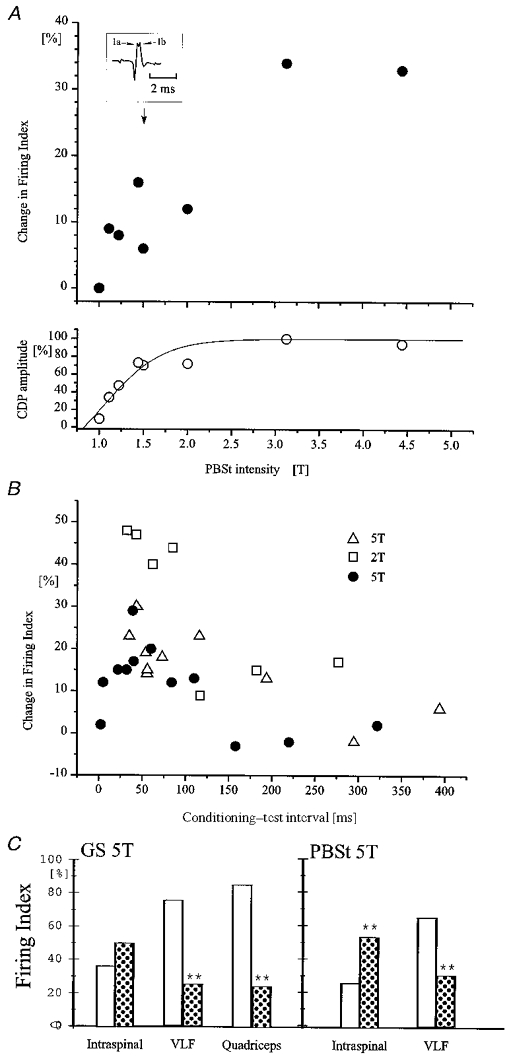
Figure 6.

Threshold and time course of excitability changes in the terminals of Ia interneurones evoked by flexor and extensor nerve stimulation
The excitability of single Q-coupled Ia inhibitory interneurones was tested by intraspinal stimulation as in Fig. 5. A, data from a single interneurone. The conditioning stimulation was applied to the PBSt motor nerve at an interval of 45 ms (5 shocks, 200 Hz). The upper graph shows the increase of terminal excitability (expressed as the percentage change in firing index (number of action potentials evoked per number of stimuli)) as a function of the intensity of the PBSt stimulation. The lower graph shows the size of the incoming volley (expressed as a percentage of the maximal volley) recorded from the cord dorsum as a function of the PBSt stimulation intensity. The inset illustrates an example of the incoming volley at an intensity of 1.5T. Notice that a clear separation of Ia and Ib components of the incoming volley can be seen. B, data from three different interneurones (indicated by different symbols). The graph shows excitability changes (expressed as in A) in the terminals of the interneurones induced by conditioning PBSt stimulation (5T, 2T and 5T; 5 pulses, 175 Hz in all cases) as a function of the conditioning-test interval. C, data from a single interneurone in which a comparison was made of the effect of conditioning GS (left-hand columns; 5T; 5 pulses, 200 Hz, conditioning-test interval 45 ms) and PBSt stimulation (right-hand columns; 5T, 5 pulses, 200 Hz, conditioning-test interval 45 ms) on the responsiveness of Ia inhibitory interneurones to (1) intraspinal stimulation of the terminals of the interneurones (Intraspinal), (2) stimulation of descending pathways in VLF (VLF) and (3) stimulation of the Q motor nerve (Quadriceps). The open bars show the firing index obtained in the absence of the conditioning stimulation. Dotted bars show the firing index when the conditioning stimuli were also applied. Asterisks indicate the level of statistical significance in relation to the control: **P < 0.001.
