
Table 2.
Statistical comparison of models fitted to the illuminance-response melatonin suppression data
| Model | Formula | Parameter estimates | Adjusted R2 | AIC | RSE |
|---|---|---|---|---|---|
| log | y = a + binx | a =−0·242 ± 0·157 | 0·63 | 5·23 | 0·065 |
| b = 0·154 ± 0·0260 | |||||
| 3 Parameter logistic | 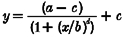 |
a =−0·161 ± 0·160 | 0·78 | 4·73 | 0·038 |
| b = 88·0 ± 41·3 | |||||
| c = 1·0 | |||||
| 4 Parameter logistic | 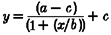 |
a =−0·0156 ± 0·0832 | 0·86 | 8·42 | 0·024 |
| b = 106 ± 13·3 | |||||
| c = 0·936 ± 0·504 | |||||
| d = 3·55 ± 1·58 | |||||
| Power | y = axb | a = 0·188 ± 0·0707 | 0·52 | 5·59 | 0·084 |
| b = 0·201 ± 0·0500 | |||||
| Cube root | y = ax0·33 | a = 0·0683 ± 0·00725 | 0·39 | 4·15 | 0·107 |
Parameters are shown with the standard deviation of the fit, and adjusted R2 is the correlation coefficient; AIC and RSE as Table 1.