
Figure 2. Force record during and following isovelocity stretches at 76.4 deg s−1.
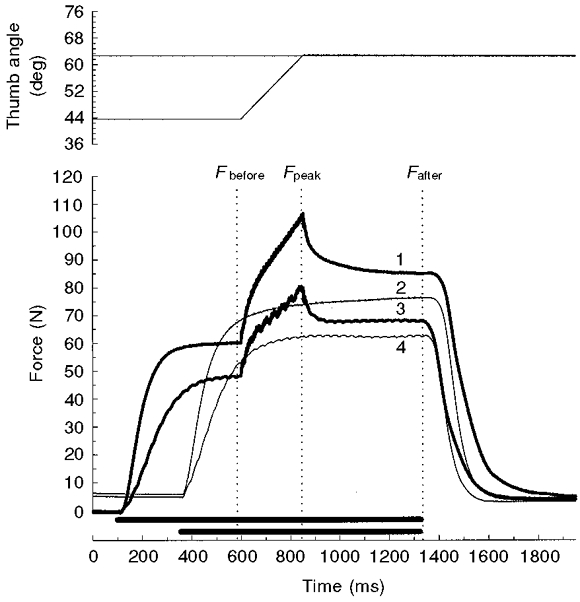
Angular displacement (top) and force data (bottom) for one subject. Stimulation (indicated by the bars above the time axis) was either at 80 Hz (traces 1 and 2) or 30 Hz (traces 3 and 4). Vertical dotted lines indicate where the forces were measured, before (Fbefore), at the peak (Fpeak) and 500 ms following the stretch (Fafter). The thick traces are the force responses before, during and after stretches from 44 to 63 deg thumb angle at 76.4 deg s−1. Note that with both the 80 and 30 Hz stimulation, the isometric force after the stretch (Fafter) was enhanced compared to the isometric forces at the 63 deg thumb angle without a preceding stretch (thin traces).