
Figure 5. Force in response to stretch at 1.9 deg s−1.
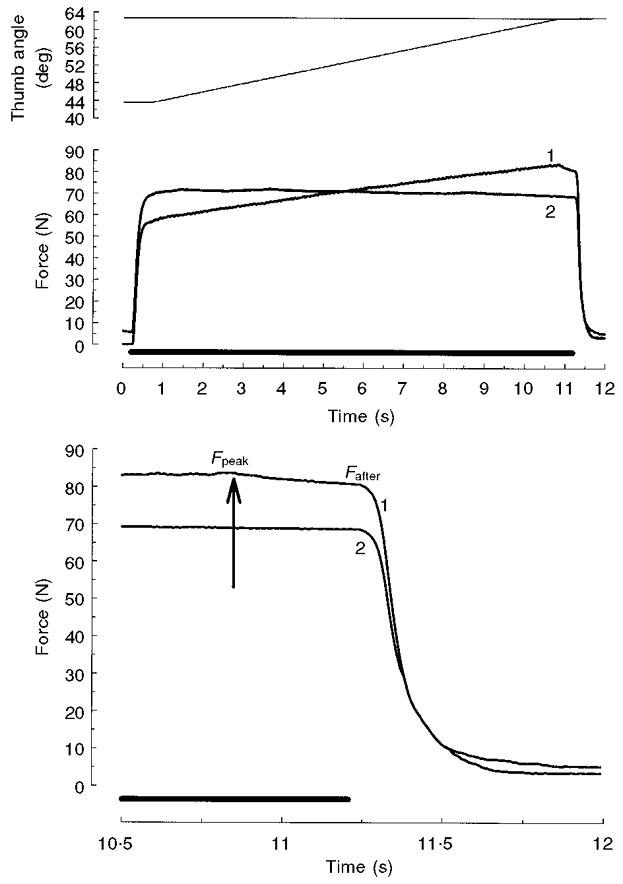
Example of an additional experiment in which the adductor pollicis muscle was either stretched from 44 to 63 deg at a very low velocity (1.9 deg s−1; trace 1) or isometrically stimulated for the same duration at the 63 deg thumb angle (trace 2). Data are from the same subject as in Fig. 2. The top panel shows angular displacement. Stimulation (50 Hz) is indicated by the bar above the time axes. The last part of the force traces (middle panel) is shown enlarged in the bottom panel, where the arrow indicates the end of the stretch. Note that isometric force following the stretch (Fafter) was considerably enhanced compared to the isometric force without a preceding stretch (trace 2); also note that peak stretch force (Fpeak) was only 3.1 N higher than Fafter.