
Figure 2. Position of the trigger zone for spikes evoked by ipsilateral EPSPs and soma stimulation.
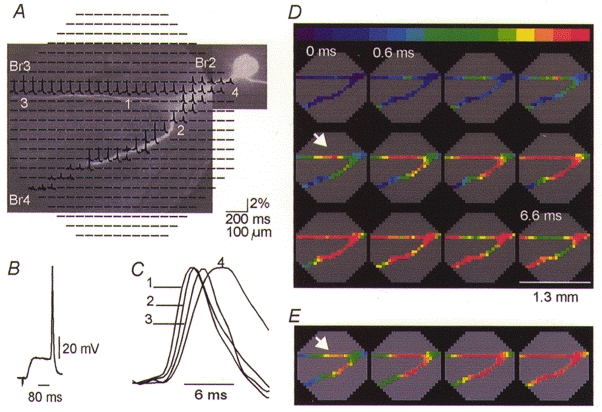
A, raw optical recordings of fluorescence signals (ΔF/F) associated with 85 mV action potentials from elements of photodiode array positioned over the fluorescence CCD image of the axonal arborizations of a metacerebral cell in situ, stained with the voltage-sensitive dye JPW 1114. In this and all subsequent figures the traces are arranged according to the disposition of the detectors in the array. A mask was applied to the recordings in A that revealed the data from relevant detectors only. Nine trials were averaged. Each diode received light from a 50 μm × 50 μm area in the object plane. Each trace represents the output of one diode for 100 ms centred around an evoked action potential. B, synaptically evoked action potential recorded by a microelectrode in the soma. C, superimposed recordings from individual detectors from different locations indicated in A, scaled to the same height, on an expanded time scale. D, colour-coded representation of the spatial and temporal dynamics of the synaptically evoked spike. The peak of the action potential is shown in red. Individual frames are separated by 0.6 ms and the position of the ipsilateral trigger zone is indicated by the arrow. E, position of the ipsilateral trigger zone (arrow) for the action potential evoked by direct stimulation of the soma under identical recording conditions to those in D.