
Figure 3. Propagation of an action potential initiated by EPSPs evoked by electrical stimulation of the ipsilateral middle lip nerve.
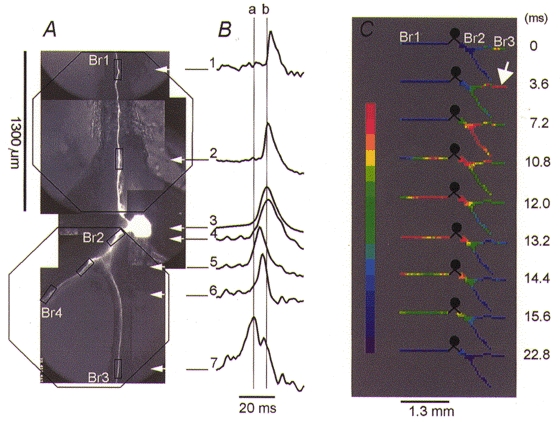
A, two separate recordings were obtained from the ipsi- and contralateral side of the cell as indicated on a CCD image of the neuron by the outline of an octagonal array on each side of the soma. B, pattern of spike propagation shown by comparing optical recordings from six different regions, indicated by rectangles on the CCD image of the cell. Vertical lines a and b indicate peaks of the first spike (trace 7) and the intrasomatic action potential (trace 3), respectively. C, spatial and temporal characteristics of spike propagation shown as a colour-coded display of the data from the same measurement. Nine trials were averaged. The position of the ipsilateral trigger zone is indicated by the arrow. See text for explanation.