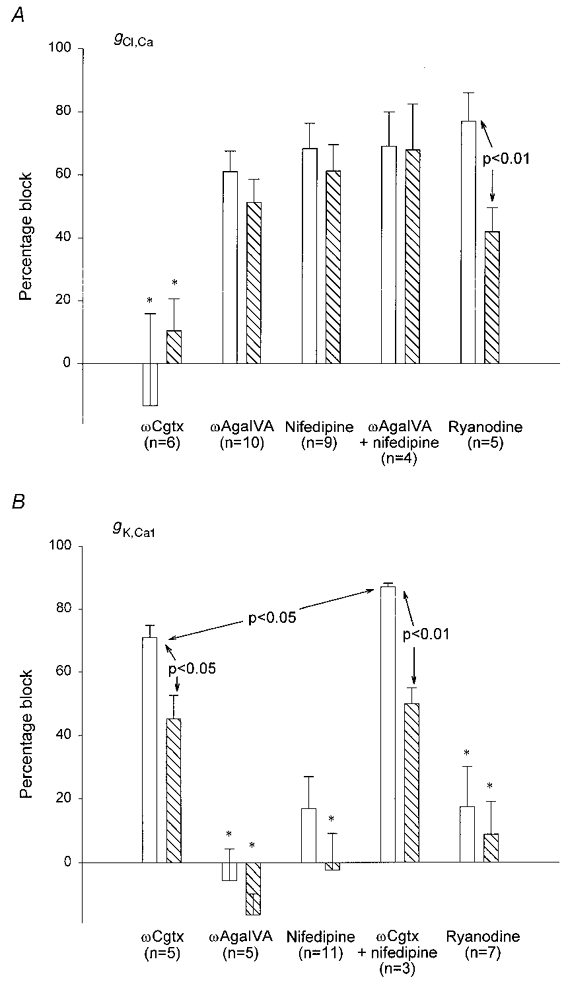
Figure 11. Percentage block of Ca2+-activated Cl− and K+ conductances following different treatments suggests the mechanisms of their activation by APs.

Changes in gCl,Ca (A) and changes in gK,Ca1 (B) (measured as total charge transfer) produced by ωCgtx GVIA, ωAga IVA, nifedipine and ryanodine (see also Tables 1 and 2). □, effect after a single AP;  , effect following a train. Data were obtained in the presence of 100 nm apamin (A) or 2 mm 9AC (B). Error bars indicate s.e.m. Statistically significant comparisons between different groups are indicated. All changes were significantly different from control (in the absence of any Ca2+ current blocker) except those marked * (see Tables 1 and 2). gCl,Ca was blocked to a similar extent by all treatments except ωCgtx GVIA. The data suggest that Ca2+ from P- and L-type channels must act together to release Ca2+ from intracellular stores that, in turn, activates Cl− channels underlying the ADP. In contrast, ωCgtx GVIA markedly reduced gK,Ca1, suggesting a direct link between Ca2+ entering through N-type channels and SK channels underlying the AHP. A small amount of Ca2+ entry through L-type channels also contributes to activation of SK channels in type II cells. See text for further discussion.
