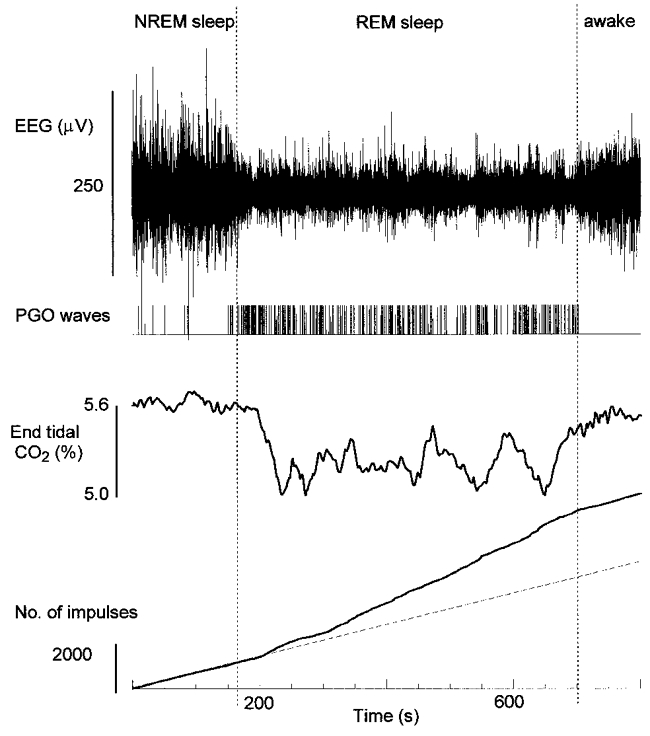
Figure 1. End-tidal CO2 percentage and activity of a respiratory neuron during spontaneous breathing in NREM and REM sleep and wakefulness.

Neuronal activity is shown as cumulative impulses from the beginning of the record. The dashed line is 8 impulses s−1. In REM sleep the mean discharge rate increased to 14 impulses s−1. The neuron was an augmenting inspiratory cell with an η2 value of 0.9.
