
Figure 6. Estimation of the detection limit and relationship to a calculated permeability ratio.
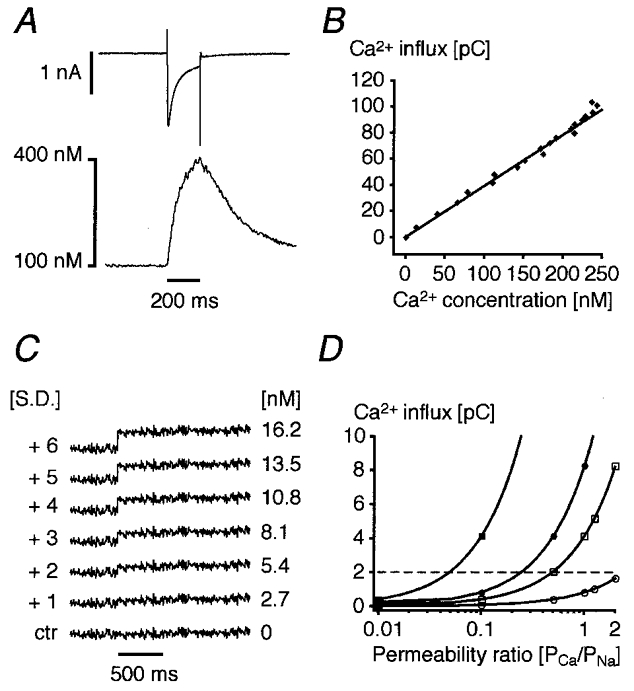
A, in a cell with blocked SR CICR an L-type Ca2+ current and the resulting Ca2+ influx signal were recorded simultaneously under control conditions. B, the Cd2+-sensitive difference current was integrated and plotted against the rising phase of the Ca2+ signal. The fitted line relates the observed Ca2+ influx fluorescence amplitude to the corresponding Ca2+ current in this given cell and corresponds to a cytosolic buffer capacity of about 28 (note that the SR was blocked). C, an mean Ca2+ concentration profile was plotted from a line-scan image and the standard deviation of the noise was calculated. After 500 ms, a step increase in Ca2+ was simulated by adding a concentration jump corresponding to a multiple of the s.d. The first step that is clearly visible coincides with +3 s.d. and, for this particular cell, corresponds to a concentration change of ∼8 nm[Ca2+]i. Taking the relationship illustrated in B we can estimate our mean detection limit for Ca2+ influx to be around 2 pC (dashed horizontal line in D). D, using the Goldmann-Hodgkin-Katz equation, the permeability ratio PCa/PNa was calculated for a 50 nA (□, ▪) or 10 nA Na+ current (○, •) and for 10 mm (•, ▪) or 1 mm[Ca2+]o (○, □), respectively.