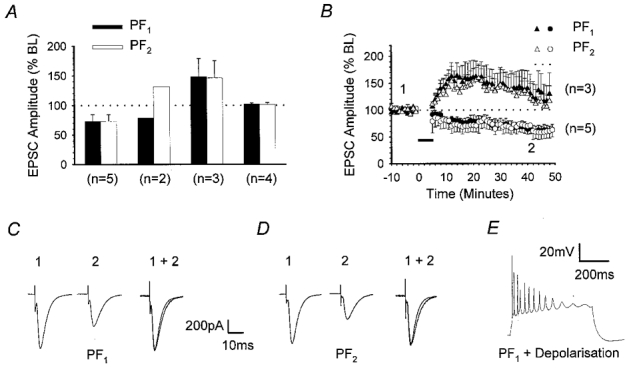
Figure 1. LTD spreads to adjacent synapses on the same PC.

Summary of the effects of pairing one of two, independent PF pathways with PC depolarisation, at 1 Hz for 5 min. Initial EPSC amplitudes of both the paired pathway responses (PF1) and those in a second pathway that was not activated during the pairing process (PF2) ranged between 500 and 600 pA. A, bar chart summarising the mean amplitude of PF1 (▪) and PF2 (□) responses, together with standard errors, measured 30 min after pairing and expressed as percentages of the mean baseline (BL) amplitudes. Data from a total of 14 recordings were subdivided into four groups according to the direction of plasticity of PF1 and PF2 responses; from left to right, these were LTD in both pathways, LTD in PF1 only, long-term potentiation (LTP) in both pathways and no change in both pathways. B, graph displaying the mean and standard errors of PF1 (•, ▴) and PF2 (○, ▵) responses over time for the recordings illustrated in A, where both pathways underwent depression (circles, n = 5) or potentiation (triangles, n = 3) after the period of conjunctive pairing (horizontal filled bar). EPSCs of representative PF1 (C) and PF2 (D) responses that underwent depression, sampled at time points 1 and 2 in B are shown. Responses taken after pairing were normalised to the peak response amplitude prior to pairing (1 + 2). E illustrates the waveform associated with conjunctive pairing in current clamp.
