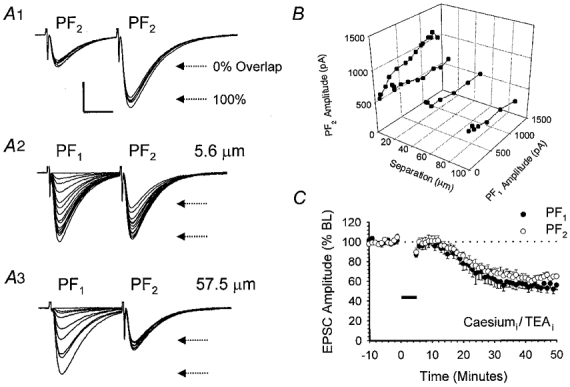
Figure 4. Heterosynaptic LTD is not due to pathway overlap or an increase in potassium conductance.

A, illustration of data from a single cell that is representative of a total of six other recordings. A1, paired stimulation of PF2 at an interval of 30 ms produced a facilitation of the second response. A total of five sequential sweeps are shown. A2, the horizontal arrows mark the mean amplitudes of the first and second responses and provide an estimate of the expected PF2 amplitude, at this stimulus strength, under conditions of 0 and 100 % pathway overlap. PF1 and PF2 stimulating electrodes were positioned 5.6 μm apart and activated sequentially at a 30 ms interval over a range of PF1 stimulus intensities. The strength of PF2 stimulation was kept constant throughout. A3, the experiment was repeated with the electrodes repositioned at a further separation of 57.5 μm. B, three-dimensional plot illustrating the relationship between PF1 and PF2 responses for the cell shown in A at inter-electrode separations of 5.6, 22.0, 57.5 and 98.8 μm. C, pooled data from a set of six recordings in which a caesium-based intracellular solution containing TEA was used. PF1 stimulation was paired with depolarisation to 0 mV in voltage clamp for 5 min. Data are expressed as in Fig. 1B.
