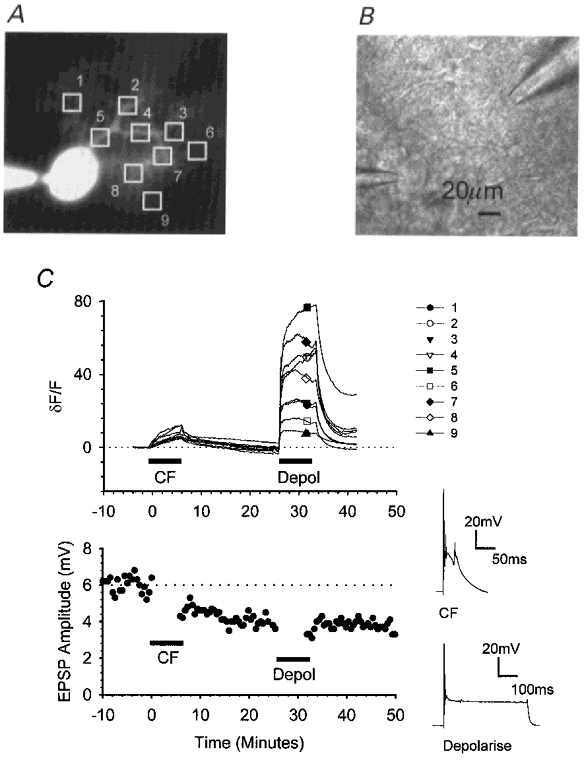
Figure 7. Somatic depolarisation elevates intracellular calcium throughout the dendritic tree.

In cells injected with the calcium indicator calcium green-1, fluorescence measurements over time were combined with electrophysiological measurements of the synaptic changes resulting from pairing PF stimulation in current clamp with CF activation followed by cell depolarisation. A, fluorescence image illustrating the positions of nine identically sized regions of interest. B, bright-field image illustrating the positions of the recording electrode (bottom left) and a single stimulating pipette (top right). C, upper graph, changes in the mean fluorescence intensities within each of the regions of interest were measured over time. For each region, intensities were normalised to the initial fluorescence level and expressed as a percentage change (δF/F). After 10 min, the CF input was activated conjunctively with PF stimulation for 5 min at 1 Hz; 25 min later, PF activation was paired with cell depolarisation. The accompanying PF responses are shown in the lower graph.
