
Figure 5. Comparison between currents carried by dKv3.1 and IKur,d.
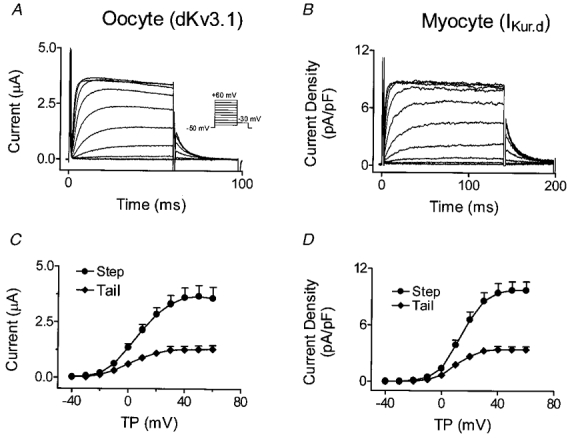
A, currents recorded from an oocyte 20 h after dKv3.1 cRNA injection. B, currents in a dog atrial myocyte. C, mean (±s.e.m.) current-voltage relation of step and tail currents recorded from oocytes (n = 8). D, mean current density-voltage relation of step and tail currents recorded from myocytes (n = 8). TP, test potential.