
Figure 4. Voltage dependence of recovery from fast and slow inactivation of class A Ca2+ channels with different β-subunit composition.
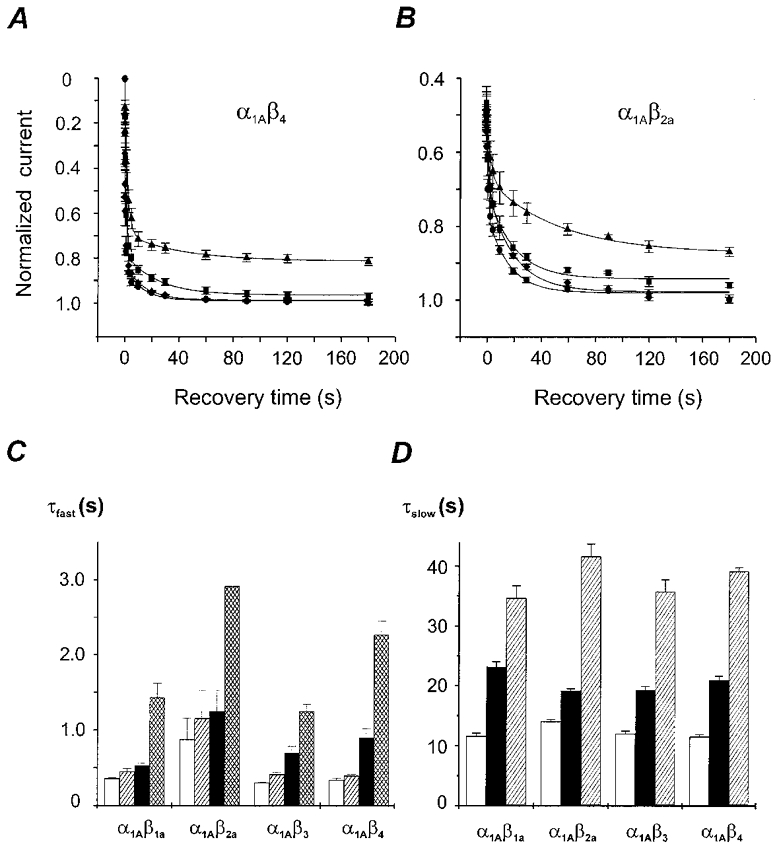
A and B, IBa recovery from inactivation after 10 s conditioning pulses to 10 mV measured by a conventional double pulse protocol (similar to Fig. 1B, top panel). The recovery potentials were −120 mV (•), −100 mV (♦), −80 mV (▪) or −60 mV (▴). The holding potential was −120 mV in all experiments. Mean recovery time courses of α1A/β4 and α1A/β2a channels are shown. Data points are fitted by a biexponential function. Fit parameters are displayed in Table 1. C, time constants of recovery from fast inactivation of class A Ca2+ channels with different β-subunit composition at −120 mV (□), −100 mV ( ) −80 mV (▪) and −60 mV (▪). D, time constants of recovery from slow inactivation at −120 mV (□), −80 mV (▪) and −60 mV (
 ) were estimated as described in Fig. 2A (n > 20). No significant differences with τslow estimated from double pulse experiments (Table 1) were observed (P > 0.05). The mean values for different subunit combinations at the corresponding holding potentials were not significantly different (P > 0.05).