
Figure 8. Comparison of the kinetics of facilitation and re-inhibition of α1B currents, in the absence and presence of co-expressed VDCC β3 subunits, during tonic and agonist-induced modulation.
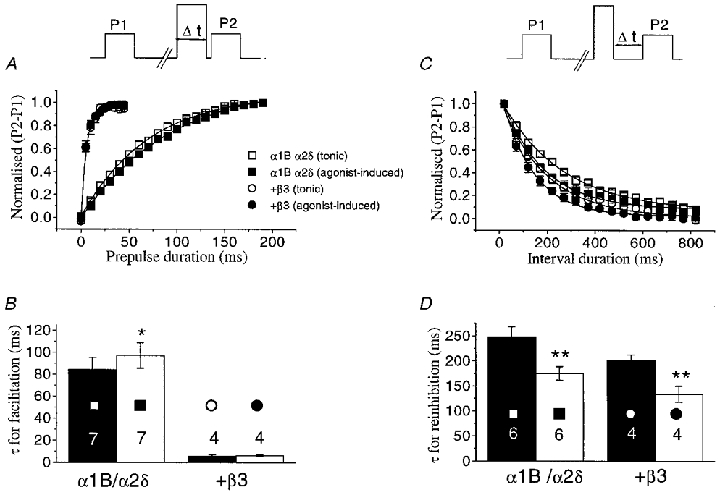
A, top panel, voltage waveform for measurement of facilitation rate. The duration of the prepulse (Δt) was increased in 5 ms (α1B/α2δ co-expressed with VDCC β subunits) or 10 ms steps (α1B/α2δ alone). All data are from −10 mV test pulses. The P1 and P2 currents were then subtracted and the plot of the difference (P2 – P1 values normalised to the maximum) was fitted to a single exponential function. The graph shows the facilitation rate for α1B/α2δ/β3 (circles) and α1B/α2δ currents (squares), both before (tonic modulation, open symbols) and during (agonist-induced modulation, filled symbols) application of quinpirole. Continuous lines are the result of single exponential fits to the data. B, the histogram gives the τ values for facilitation, determined from exponential fits to individual data, for the subunit combinations shown beneath the histogram bars. The filled bars indicate the tonic modulation condition, and the open bars represent agonist-induced modulation. C, top panel, voltage waveform for measurement of re-inhibition rate: following the depolarizing prepulse, the time before the subsequent test pulse (Δt) was progressively increased in 50 ms steps from 20 to 820 ms. Currents were measured and normalised as for the facilitation protocols, and the data were fitted to a single exponential, shown by the continuous lines. All data are from −10 mV test pulses, and data are shown for α1B/α2δ and α1B/α2δ/β3 combinations, using the same symbols as in A. The histogram gives the τ values for re-inhibition, determined from exponential fits to the individual measurements, for the subunit combinations shown beneath the histogram bars. The filled bars indicate the tonic modulation condition, and the open bars represent agonist-induced modulation. Numbers on the histogram bars in both B and D indicate the number of cells for each condition, and statistical significance, of tonic compared to agonist induced modulation, is indicated by *P < 0.05 and **P < 0.01 (Student's paired t test).