
Figure 2.
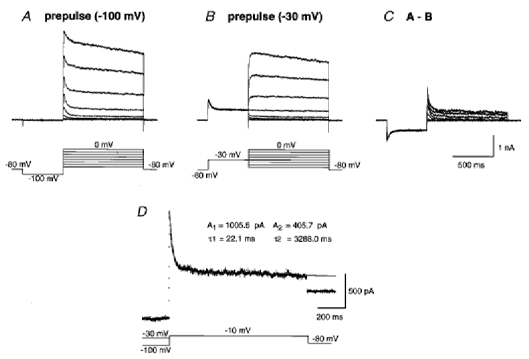
TOCs isolated by the subtraction protocol
A, whole-cell currents (upper traces) evoked by application of a series of depolarizing voltage steps with 10 mV intervals (lower traces) to a neuron following a 500 ms prepulse to −100 mV. B, sustained outward currents evoked by application of the same depolarizing voltage steps as in A following a prepulse to −30 mV. C, isolated TOCs obtained by subtraction of the traces shown in B from those shown in A. D, the decay phase of a current trace obtained by the subtraction protocol was fitted by the sum of two exponential functions. Double-exponential fits are superimposed on the decay phase of a TOC depicted by the dotted trace.