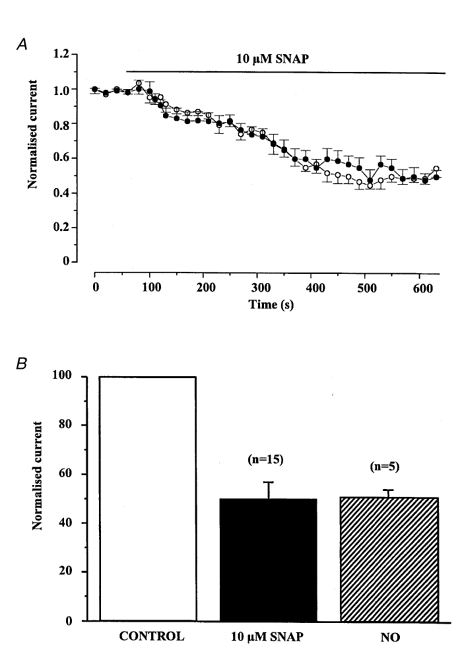
Figure 2.

Inhibitory effect of SNAP on Iswell
A, the mean time dependence of the SNAP-induced inhibition of Iswell shown at −50 mV (○) and +100 mV (•). Each point is the mean ±s.e.m. of 15 cells. B, comparison of the maximum SNAP- and NO-induced inhibition of Iswell recorded at −50 mV. Currents were normalised to peak Iswell prior to application of SNAP or NO.
