
Figure 3.
Transmission dynamics at synapses from distinct CA3 interneurons
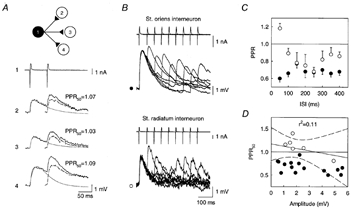
A, synaptic responses of 3 postsynaptic pyramidal cells to paired stimuli delivered to a stratum radiatum interneuron. The mean amplitude of the first response varied from 1.6 mV (cell 3) to 2.5 mV (cell 4) but PPF was similar in all postsynaptic cells. Dashed trace, second IPSP isolated after digital subtraction of the first IPSP fitted with two exponentials (smooth trace). B, pairs of stimuli at intervals of 50–400 ms delivered to either stratum oriens or stratum radiatum interneurons. A and B show the mean of 25–30 consecutive responses. C, IPSPs induced by stratum oriens interneurons (•) showed marked PPD at all interstimulus intervals (ISIs). IPSPs from stratum radiatum interneurons (○) showed PPF at short intervals (< 100 ms) and PPD at longer intervals. Each point represents the mean and s.e.m. from 8 (stratum oriens) and 5 (stratum radiatum) pairs. D, PPRs were not correlated with the amplitude of the first IPSP in 21 cell pairs. Continuous line, linear regression. Dashed lines, 95% confidence intervals.