
Figure 3. Effects of high extracellular HCO3− concentrations on intracellular pH.
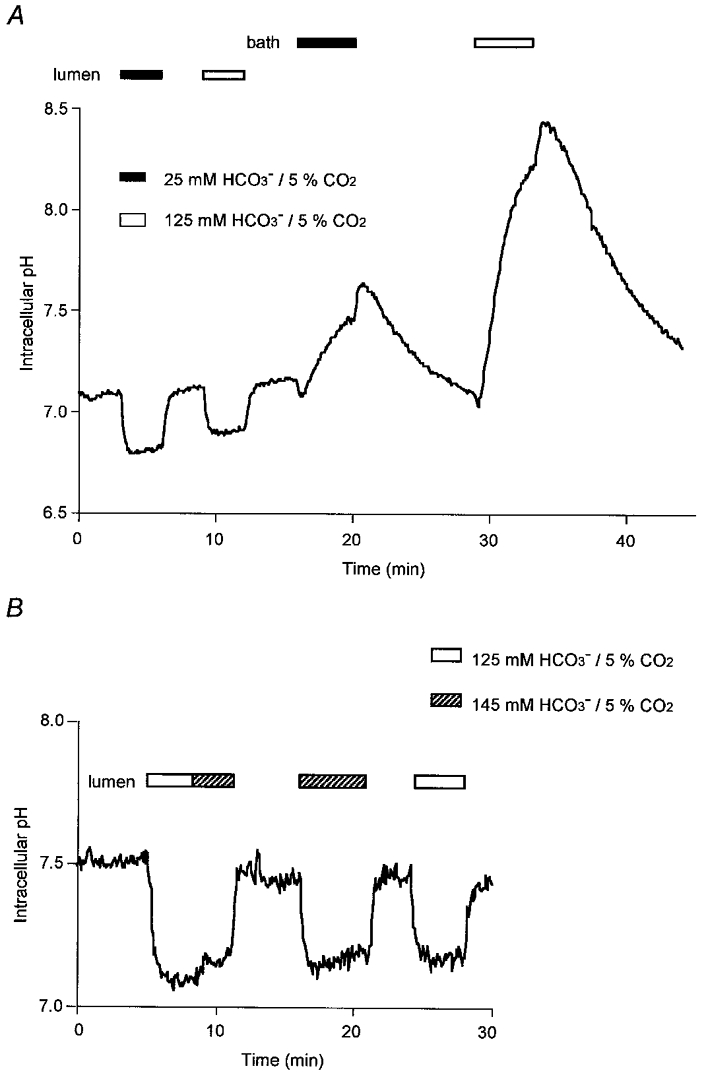
Initially the bath and lumen of the duct segments were separately perfused with the standard Hepes-buffered solution. Thereafter, in A (representative of 5 experiments), the luminal perfusate and then the bath solution was switched first to 25 mm HCO3−-5 % CO2 (filled bar) and then to 125 mm HCO3−-5 % CO2 (open bar). In B (representative of 5 experiments), the lumen was exposed either to 125 mm HCO3−-5 % CO2 (open bar) or to 145 mm HCO3−-5 % CO2 (hatched bar).