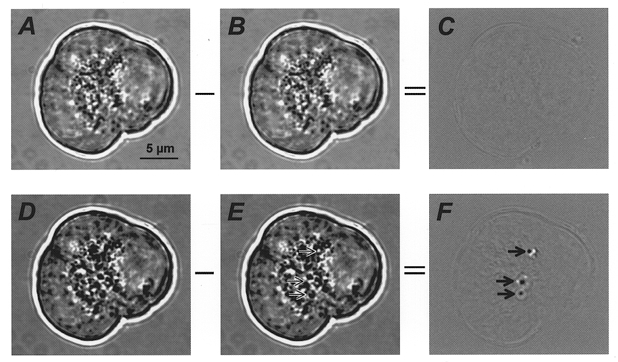
Figure 1. Continuous, time-differential analysis of ACh-evoked changes in acinar cell morphology.

Brightfield images of an acinus consisting of three cells are shown before (A and B) and during (D and E) treatment with 10 μm ACh. Subtraction of one frame from its predecessor (A–B or D–E) creates a time-differential image (C or F, respectively). Three exocytotic events are clearly visible in F (arrows); arrows in E indicate the regions where these exocytotic events occurred.
