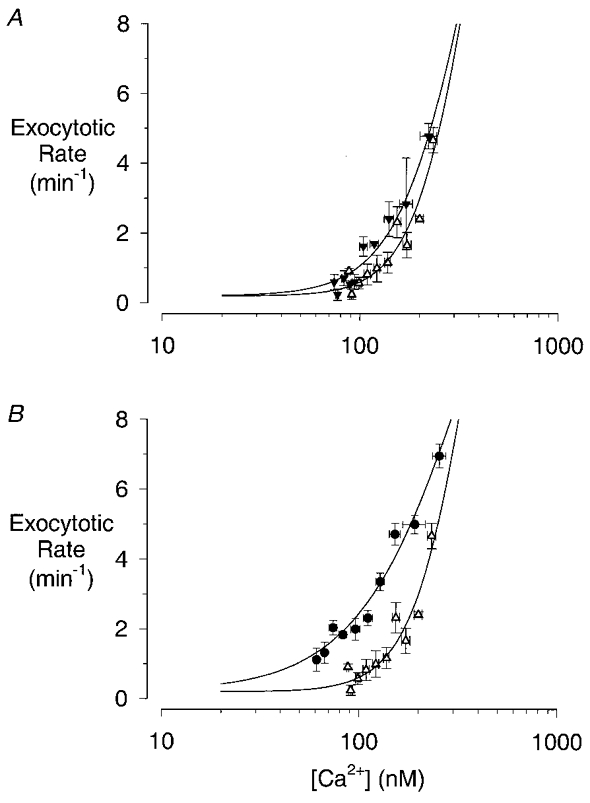
Figure 5. [Ca2+]i dependency of the slow phase of secretion.

A, plots of the data in Fig. 4Bvs. the data in Fig. 4A for ACh concentrations of 250 nm (▵) and 1 μm (▾). B, plots of the data in Fig. 4Bvs. the data in Fig. 4A for ACh concentrations of 250 nm (▵) and 10 μm (•). Pairs of data points, between 40 and 340 s after the start of ACh application, were ranked in order of [Ca2+] and then divided into bins of three samples each; points represent the mean ±s.e.m. (vertical error bars) or ±s.d. (horizontal error bars). The continuous lines are least-squares fits to eqn (1) with m= 0.2 min−1; a= 19.8 min−1; b= 2.95 (250 nm) or 2.36 (1 μm) or 1.52 (10 μm), and k= 371 nm (250 nm) or 370 nm (1 μm) or 393 nm (10 μm); r2= 0.90 (250 nm), 0.95 (1 μm) and 0.97 (10 μm).
