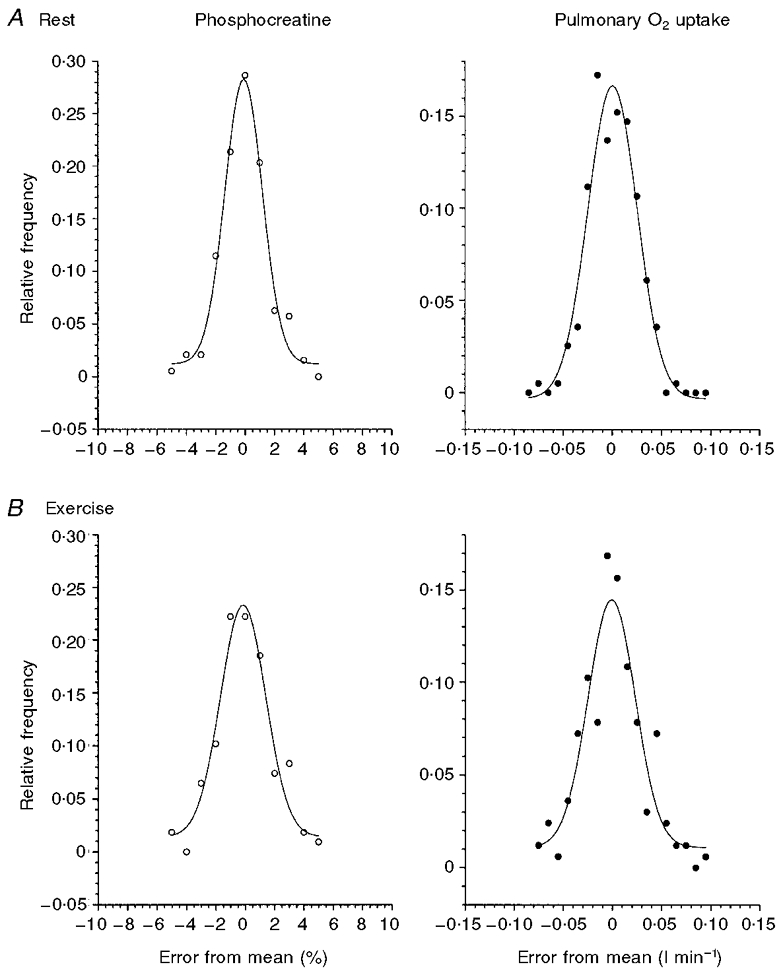
Figure 2. Examples of amplitude probability density functions for intersample fluctuations of [PCr] and V̇O2 measurements during the steady state at rest (A) and moderate exercise (B) for subject 1.

Relative frequency is calculated as the actual frequency relative to the total sample number (n) for that subject.
