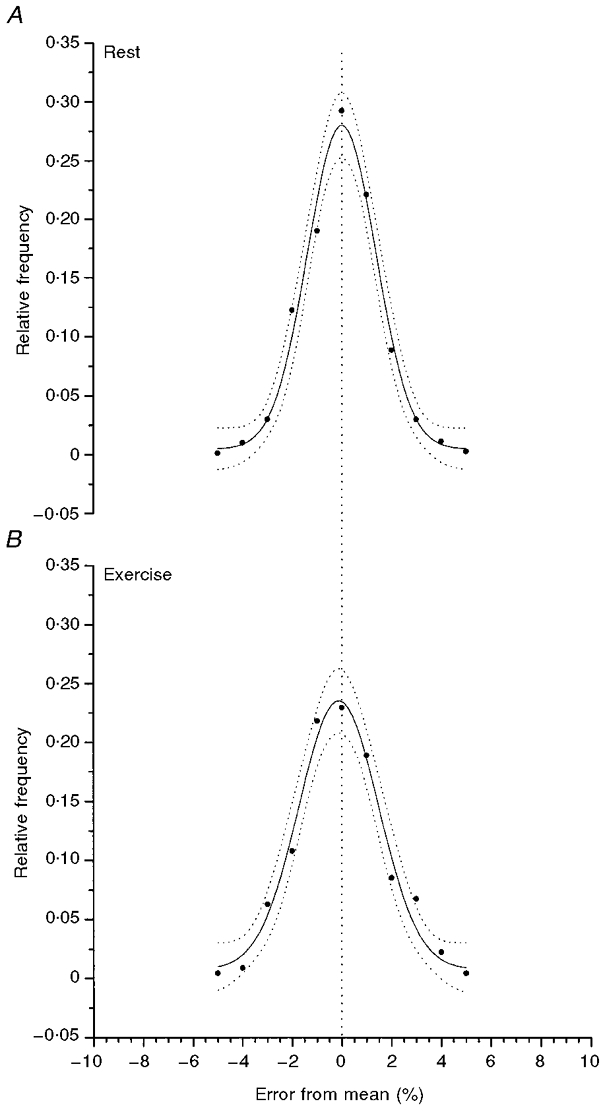
Figure 3. The PDF for the distribution of intersample fluctuations of [PCr] in the steady state at rest (A), or during exercise (B).

The data are the average for all six subjects. The Gaussian distribution provides a good description of the PDF and the dotted lines give the 95 % confidence intervals of the estimation.
