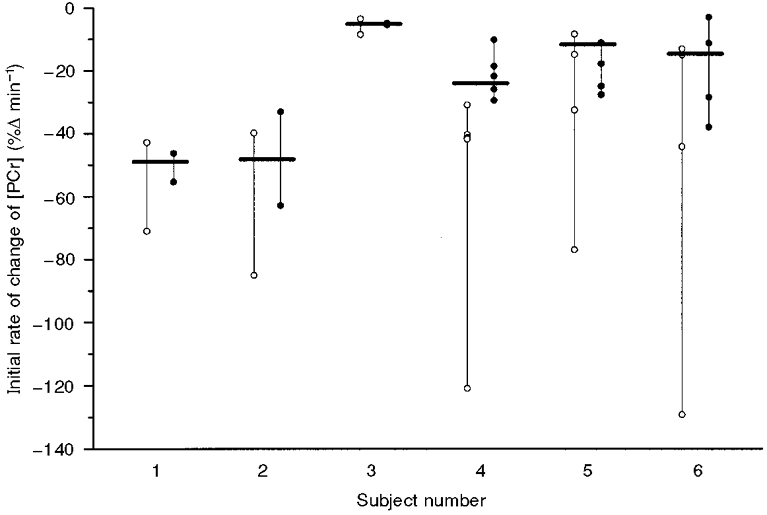
Figure 7. Estimation of the initial rate of change of [PCr] (d[PCr]/dt) using two methods in six subjects.

d[PCr]/dt is estimated from the regression from the baseline at time zero to the first item of data acquired (i.e. 15 s into the exercise) (○). Alternatively, d[PCr]/dt is estimated from the kinetic parameters of the best fit exponential (•). The black bars represent the estimation of d[PCr]/dt with the highest confidence, i.e. estimated from the best fit exponential to the averaged data where the standard deviation (S0) of the fluctuations is reduced.
